性能分析
数据库调优的目标:响应时间更快,吞吐量更大。
数据库服务器的优化步骤
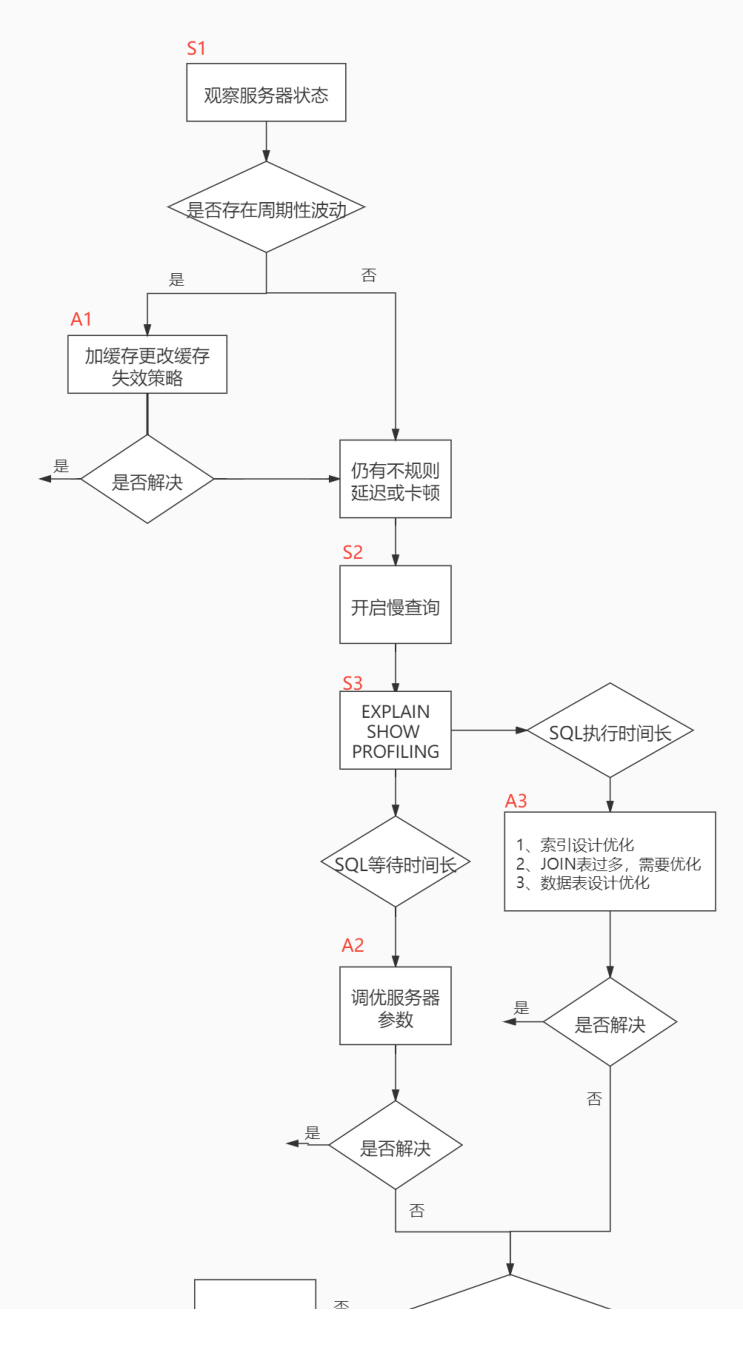

观察服务器在状态
- 观察服务器状态
- 开启慢查询日志
- explain、show profiling
行动
- 加缓存、更改缓存失效策略 (存在周期性波动)
- 调优服务器参数(SQL 等待时间长)
- 适当的增加数据库缓冲池
- 表相关优化(SQL 执行时间长)
- 索引设计优化
- join 表过多,�需要优化
- 数据表设计优化
- 架构优化(SQL 查询达到瓶颈)
- 读写分离(主从架构)
- 分库分表(垂直分库、垂直分表、水平分表)
查询系统性能参数
SHOW [GLOBAL|SESSION] STATUS LIKE '参数';
- Connections:连接 MySQL 服务器的次数
- Uptime:mysql 服务器的上线时间
- Slow_queries:慢查询次数
- Innodb_rows_read
- Innodb_rows_inserted
- Innodb_rows_updated
- Innodb_rows_deleted
- Com_select:查询操作的次数
- Com_insert:插入操作的次数
- Com_update:更新操作的次数
- Com_delete:删除操作的次数
统计 sql 的查询成本 last_query_cost
查询成本指的是:SQL 语句所需要读取的页的数量。
last_query_cost 是优化器估计出来的,并不是实际值。
show status like 'last_query_cost';
sql 查询是一个动态的过程,从页加载的角度来看,我们可以得到以下两点结论
- 位置决定效率。如果页就在数据库缓冲池中,那么效率是最高的,否则还需要从内存或者磁盘中进行读取,当然针对单个页的读取来说,如果页存在于内存中,会比在磁盘中读取效率高很多。
- 批量决定效率。如果我们从磁盘中对单一页进行随机读,那么效率是很低的(差不多10ms),而采用顺序读取的方式,批量对页进行读取,平均一页的读取效率就会提升很多,甚至要快于单个页面在内存中的随机读取。
定位执行慢的 sql:慢查询日志
MySQL 的慢查询日志,用来记录在 MySQL 中响应时间超过阈值的语句,具体指运行时间超过 long_query_time 的值的 SQL,则会被记录到慢查询日志中。 long_query_time 的默认值为 10,意思是运行 10 秒以上(不含10秒)的语句,认为是超出了我们的最大忍耐时间值。
开启�慢查询
查询慢查询是否开启
show variables like `%slow_query_log%`;
开启
set global slow_query_log='ON';
修改慢查询的阈值
show variables like '%long_query_time%';
设置超时时间为 1 秒。
set long_query_time=1;
查看慢查询的数目
SHOW GLOBAL STATUS LIKE '%Slow_queries%';
查询慢查询日志的路径
SHOW VARIABLES LIKE 'slow_query_log_file';
慢查询日志分析工具:mysqldumpslow
按照查询时间排序,查看前 5 条 sql 语句
mysqldumpslow -s t -t 5 /var/lib/mysql/atguigu1-slow.log
得到返回记录集最多的10个SQL
mysqldumpslow -s r -t 10 /var/lib/mysql/atguigu1-slow.log
得到访问次数最多的10个SQL
mysqldumpslow -s c -t 10 /var/lib/mysql/atguigu1-slow.log
得到按照时间排序的前10条里面含有左连接的查询语句
mysqldumpslow -s t -t 10 -g "left join" /var/lib/mysql/atguigu1-slow.log
另外建议在使用这些命令时结合 | 和more 使用 ,否则有可能出现爆屏情况
mysqldumpslow -s r -t 10 /var/lib/mysql/atguigu-slow.log | more
查看 sql 执行成本:show profile
show profile 默认处于关闭状态
开启这个功能
show variables like 'profiling';
set profiling = 'ON';
show profiles;
分析查询语句:explain
id
在一个大的查询语句中每个 select 关键字都对应一个唯一的 id。
- id 如果相同,可以认为是同一组,从上往下顺序执行
- 在所有组中,id 值越大,优先级越高,越先执行
- 关注点:每个 id 号码,表示一趟独立的查询,一个 sql 的查询次数越少越好
select_type
- simple:查询中不包含子查询或者 union
- primary:查询中若包含任何复杂的子部分,最外层查询则被标记为 primary
- subquery:select 或 where 中包含的子查询
- derived:from 中包含的子查询
- union
- union result
- dependent subquery:select、where 中包含的子查询,子查询基于外层
- uncacheable subquery:无法被缓存的子查询
table
表名
partitions
匹配的分区信息
type:访问类型
- system:表只有一行记录,(const 的特例)
- const:表示通过索引一次就找到了, const 用于比较 primary key 或这 unique 索引。因为只需要匹配一行数据,所以很快。如果将主键置于 where 列表中,MySQL 就能将该查询转换为一个 const 。
- eq_ref:唯一性索引扫描,对于每个索引键,表中只有一条记录与之匹配。常见于主键或唯一索引扫描。
- ref:非唯一索引扫描,返回匹配某个单独值的所有行。(可能会返回多个符合条件的行)
- range:只检索给定范围的行,使用一个索引来选择行。 key 列显示使用了哪个索引。一般就是在 where 语句中出现了 between、
<、>、in 等查询。 - index:Full Index Scan , index 与 All 区别为 index 类型只遍历索引树。这通常比 ALL 快,因为索引文件通常比数据文件小。(Index 与 ALL 虽然都是读全表,但是 index 是从索引树中读取,而 ALL 是从硬盘读取)
- all:Full Table Scan,遍历全表以找到匹配的行。
system > const > eq_ref > ref > range > index > all
实际
show create table user; 查看 user表结构。
CREATE TABLE `user` (
  `id` bigint NOT NULL AUTO_INCREMENT,
  `name` varchar(30) CHARACTER SET utf8mb4 COLLATE utf8mb4_unicode_ci NOT NULL,
  `age` int NOT NULL,
  `email` varchar(30) COLLATE utf8mb4_unicode_ci DEFAULT NULL,
  PRIMARY KEY (`id`),
  UNIQUE KEY `idx_name` (`name`),
  KEY `index_age` (`age`) USING BTREE
) ENGINE=InnoDB AUTO_INCREMENT=21 DEFAULT CHARSET=utf8mb4 COLLATE=utf8mb4_unicode_ci
const

eq_ref

ref

range

index

all

possible_keys
可能用到的索引
key
实际上使用的索引
key_len
显示 MySQL 实际决定使用的索引的长度。如果索引是 null ,则长度为 null。如果不是 null,则为使用的索引的长度。
计算规则
- 定长字段, int 占用 4 个字节,date 占用 3 个字节。char(n) 占用 n 个字符。
- 变长字段 varchar(n) 占用 n 个字符 + 2 个字节。
- 不同的字符集,一个字符占用的字节数是不同的。gbk 一个字符占 2 字节,utf-8 一个字符占 3 个字节。
- 对于所有的索引字段,如果设置为允许为 null ,则还需要加 1 个字节。(MySQL 需要额外一个字节来表示是否为 null)
ref
当使用索引列等值查询时,与索引列进行等值匹配的对象信息
rows
预估的需要读取的记录条数
filtered
某个表经过搜索条件过滤后剩余记录条数的百分比
Extra
no tables used
当查询语句的没有 FROM 子句时将会提示该额外信息。
explain select 1;
using index
相应的 select 操作使用了覆盖索引。

using index condition
表示MySQL 可以在索引级别过滤数据,而不是在找到所有可能的行之后再进行过滤,从而减少了访问表数据的需要。

using where
MySQL 服务器将在存储引擎检索行后再进行过滤。许多 where 条件里设计索引中的列,当它读取索引时,就能被存储引擎检验,因此不是所有带 where 字句的查询都会显示 using where。有时 using where 的出现就是一个暗示,查询可受益与不同的索引。

using temporary
需要使用临时表来存储结果集,常用于�排序和分组查询。

using filesort
MySQL 中无法利用索引完成的排序操作成为文件排序。

using join buffer
在获取连接条件时没有使用索引,并且需要连接缓冲区来存储中间结果。如果出现了这个值,那应该注意,根据查询的具体情况可能需要添加索引来改进性能。
impossible where
强调了 where 语句会导致没有符合条件的行。
EXPLAIN SELECT * FROM s1 WHERE 1 != 1;
select tables optimized away
仅通过使用索引,优化器可能仅从聚合函数结果中返回一行。
分析优化器执行计划:trace
可以跟踪优化器做出的各种决策(比如访问表的方法、各种开销计算、各种转换等),并将跟踪结果记录到 INFORMATION_SCHEMA.OPTIMIZER_TRACE。
开启,并设置格式为 JSON
SET optimizer_trace="enabled=on",end_markers_in_json=on;
设置最大的使用内存
set optimizer_trace_max_mem_size=1000000;
使用
select * from student where id < 10;
select * from information_schema.optimizer_trace\G
{
  "steps": [
    {
      "join_preparation": { // 预备工作
        "select#": 1,
        "steps": [
          {
            "expanded_query": "/* select#1 */ select `student`.`id` AS `id`,`student`.`stuno` AS `stuno`,`student`.`name` AS `name`,`student`.`age` AS `age`,`student`.`classId` AS `classId` from `student` where (`student`.`id` < 10)"
          }
        ] /* steps */
      } /* join_preparation */
    },
    {
      "join_optimization": {
        "select#": 1,
        "steps": [
          {
            "condition_processing": {
              "condition": "WHERE",
              "original_condition": "(`student`.`id` < 10)",
              "steps": [
                {
                  "transformation": "equality_propagation",
                  "resulting_condition": "(`student`.`id` < 10)"
                },
                {
                  "transformation": "constant_propagation",
                  "resulting_condition": "(`student`.`id` < 10)"
                },
                {
                  "transformation": "trivial_condition_removal",
                  "resulting_condition": "(`student`.`id` < 10)"
                }
              ] /* steps */
            } /* condition_processing */
          },
          {
            "substitute_generated_columns": {
            } /* substitute_generated_columns */
          },
          {
            "table_dependencies": [
              {
                "table": "`student`",
                "row_may_be_null": false,
                "map_bit": 0,
                "depends_on_map_bits": [
                ] /* depends_on_map_bits */
              }
            ] /* table_dependencies */
          },
          {
            "ref_optimizer_key_uses": [
            ] /* ref_optimizer_key_uses */
          },
          {
            "rows_estimation": [
              {
                "table": "`student`",
                "range_analysis": {
                  "table_scan": {
                    "rows": 3989134,
                    "cost": 401710
                  } /* table_scan */,
                  "potential_range_indexes": [
                    {
                      "index": "PRIMARY",
                      "usable": true,
                      "key_parts": [
                        "id"
                      ] /* key_parts */
                    }
                  ] /* potential_range_indexes */,
                  "setup_range_conditions": [
                  ] /* setup_range_conditions */,
                  "group_index_range": {
                    "chosen": false,
                    "cause": "not_group_by_or_distinct"
                  } /* group_index_range */,
                  "skip_scan_range": {
                    "potential_skip_scan_indexes": [
                      {
                        "index": "PRIMARY",
                        "usable": false,
                        "cause": "query_references_nonkey_column"
                      }
                    ] /* potential_skip_scan_indexes */
                  } /* skip_scan_range */,
                  "analyzing_range_alternatives": {
                    "range_scan_alternatives": [
                      {
                        "index": "PRIMARY",
                        "ranges": [
                          "id < 10"
                        ] /* ranges */,
                        "index_dives_for_eq_ranges": true,
                        "rowid_ordered": true,
                        "using_mrr": false,
                        "index_only": false,
                        "in_memory": 1,
                        "rows": 9,
                        "cost": 1.16248,
                        "chosen": true
                      }
                    ] /* range_scan_alternatives */,
                    "analyzing_roworder_intersect": {
                      "usable": false,
                      "cause": "too_few_roworder_scans"
                    } /* analyzing_roworder_intersect */
                  } /* analyzing_range_alternatives */,
                  "chosen_range_access_summary": {
                    "range_access_plan": {
                      "type": "range_scan",
                      "index": "PRIMARY",
                      "rows": 9,
                      "ranges": [
                        "id < 10"
                      ] /* ranges */
                    } /* range_access_plan */,
                    "rows_for_plan": 9,
                    "cost_for_plan": 1.16248,
                    "chosen": true
                  } /* chosen_range_access_summary */
                } /* range_analysis */
              }
            ] /* rows_estimation */
          },
          {
            "considered_execution_plans": [
              {
                "plan_prefix": [
                ] /* plan_prefix */,
                "table": "`student`",
                "best_access_path": {
                  "considered_access_paths": [
                    {
                      "rows_to_scan": 9,
                      "access_type": "range",
                      "range_details": {
                        "used_index": "PRIMARY"
                      } /* range_details */,
                      "resulting_rows": 9,
                      "cost": 2.06248,
                      "chosen": true
                    }
                  ] /* considered_access_paths */
                } /* best_access_path */,
                "condition_filtering_pct": 100,
                "rows_for_plan": 9,
                "cost_for_plan": 2.06248,
                "chosen": true
              }
            ] /* considered_execution_plans */
          },
          {
            "attaching_conditions_to_tables": {
              "original_condition": "(`student`.`id` < 10)",
              "attached_conditions_computation": [
              ] /* attached_conditions_computation */,
              "attached_conditions_summary": [
                {
                  "table": "`student`",
                  "attached": "(`student`.`id` < 10)"
                }
              ] /* attached_conditions_summary */
            } /* attaching_conditions_to_tables */
          },
          {
            "finalizing_table_conditions": [
              {
                "table": "`student`",
                "original_table_condition": "(`student`.`id` < 10)",
                "final_table_condition   ": "(`student`.`id` < 10)"
              }
            ] /* finalizing_table_conditions */
          },
          {
            "refine_plan": [
              {
                "table": "`student`"
              }
            ] /* refine_plan */
          }
        ] /* steps */
      } /* join_optimization */
    },
    {
      "join_execution": {
        "select#": 1,
        "steps": [
        ] /* steps */
      } /* join_execution */
    }
  ] /* steps */
}
MySQL 监控分析视图 sys schema
风险提示:
通过sys库去查询时,MySQL会 消耗大量资源 去收集相关信息,严重的可能会导致业务请求被阻塞,从而引起故障。建议生产上 不要频繁 的去查询sys或者performance_schema、information_schema来完成监控、巡检等工作。
索引情况
#1. 查询冗余索引
select * from sys.schema_redundant_indexes;
#2. 查询未使用过的索引
select * from sys.schema_unused_indexes;
#3. 查询索引的使用情况
select index_name,rows_selected,rows_inserted,rows_updated,rows_deleted from sys.schema_index_statistics where table_schema='dbname' ;
表相关
# 1. 查询表的访问量
select table_schema,table_name,sum(io_read_requests+io_write_requests) as io from sys.schema_table_statistics group by table_schema,table_name order by io desc;

# 2. 查询占用buffer pool较多的表
select object_schema,object_name,allocated,data
from sys.innodb_buffer_stats_by_table order by allocated limit 10;

# 3. 查看表的全表扫描情况
select * from sys.statements_with_full_table_scans where db='dbname';
语句相关
#1. 监控SQL执行的频率
select db,exec_count,query from sys.statement_analysis order by exec_count desc;

#2. 监控使用了排序的SQL
select db,exec_count,first_seen,last_seen,query
from sys.statements_with_sorting limit 1;

#3. 监控使用了临时表或者磁盘临时表的SQL
select db,exec_count,tmp_tables,tmp_disk_tables,query
from sys.statement_analysis where tmp_tables>0 or tmp_disk_tables >0 order by (tmp_tables+tmp_disk_tables) desc;
IO 相关
#1. 查看消耗磁盘IO的文件
select file,avg_read,avg_write,avg_read+avg_write as avg_io
from sys.io_global_by_file_by_bytes order by avg_read limit 10;
InnoDB 相关
#1. 行锁阻塞情况
select * from sys.innodb_lock_waits;